Flight
Test IV
Phugoid Mode Determination
For
The
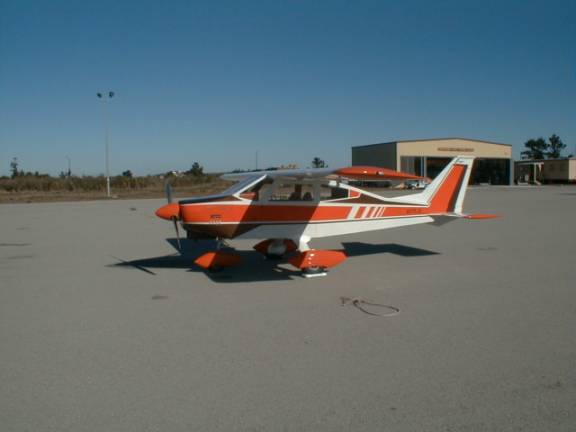
KOPP BD-4 N375JK “Miss Daisy”
By LT Kenneth G. Kopp
Co-Builder/Owner of the Kopp BD-4 “Miss Daisy”
Table of
Contents
List of Figures
Figure 1 100 mph Stick free phugoid
Figure 5 140 mph Stick Free (accel)
List of Tables
Table 1 Crew and altitude
assignments
Table 2 Flight Responsibilities
Table 3 100 mph Stick Free (initial
decel)
Table 5 Phugoid Damping Ratio
ζ
Table 7 100 mph Phugoid Transfer Function
Table 8 Phugoid Response Table
Table 9 Kopp BD-4 Performance
Summary Table
Introduction
Flight test 1 through 3 were conducted to investigate power required, power available and neutral point determination for the purpose of compiling a comprehensive performance summary table for the Kopp BD-4. The summary table contains both operational and design performance specifications useful to both the engineer and pilot alike. In this report results from flight test 4, phugoid mode determination, will be discussed and the summary table expanded to include those results.
The longitudinal phugoid mode is physically described as a damped vertical oscillation of the aircraft’s c.g. trajectory about the horizontal flight path with the velocity decreasing (or increasing) during an altitude increase (or decrease).[1] Mechanically this mode results in an exchange of potential energy with kinetic energy including subsequent loss of energy due to aerodynamic drag, which provides damping to the system. Generally, an aircrafts phugoid mode even when unstable does not greatly affect a pilots ability to safely handle the aircraft as the frequency is typically much lower than the frequency of pilot corrections. However, during IMC flight where pilot workload is increased, due to navigational procedures (chart reading, added communications, etc), an unstable phugoid will require the pilot to diligently monitor the aircrafts altitude and airspeed providing less hands free time for chart and communications work. This is especially true in single place aircraft where a single pilot must handle all the duties of flight. A total of six data collection runs were conducted in the Kopp BD-4. Three runs each were conducted at airspeeds of 100 and 140 mph (Vias). Both stick free and stick fixed response were recorded during this test. Additionally, the prototype data acquisition system G.A.I.M.S. (general aviation inertial measurement system) was utilized to capture the phugoid mode by recording variations in normal acceleration during a single stick free maneuver. The data collected by hand will be used to help validate the general accuracy of the G.A.I.M.S. unit.
Part I –
Flight Test
General Information
This test was conducted in the Kopp BD-4 on 8 Sept,
2000 departing from Monterey Peninsula Airport (MRY) at 10:00 am. Conditions at take-off were:
Wind: 310/8
Alt: 29.96
Sky Clear
Rwy: 28R
Crew and altitude assignments were as follows:
Table 1 Crew and altitude assignments
Crew
|
Altitude |
Gross Weight (approx) |
|
LT Ken Kopp / LT Jeff D’Latri |
5500 ft |
2025 lbs |
The test area was restricted to Salinas Valley from Salinas to 15 miles South East of King City. Crew coordination and a thorough test procedures briefing preceded each flight. Data collection sheets were developed, printed and discussed in detail prior to flight as well. Specific responsibilities were delegated as follows:
Table 2 Flight Responsibilities
|
Responsibility |
Pilot at the Controls |
Pilot Not at the Controls |
Flight Safety |
Primary |
Secondary |
|
Airwork |
Primary |
|
|
Test Procedure |
|
Primary |
|
Data Recording |
|
Primary |
|
Communications |
Primary |
Secondary |
|
Navigation |
Secondary |
Primary |
|
Visual Lookout |
Secondary |
Primary |
|
Emergencies |
Primary |
Secondary |
ATC flight following was utilized to the maximum extent possible to aid in collision
avoidance. King City and Salinas Muni were designated primary diverts in the event an emergency due to mechanical failure or weather occurred.
Flight
Test Technique
The
aircraft was trimmed in level flight at 5,500 ft (indicated) at an initial
airspeed of 100 mph (Vias).
The aircraft was slowly decelerated by smooth application of back stick
(yoke) against trim until an airspeed change of –20 mph was attained. The yoke was released and the aircraft
allowed to fly hands free until all oscillations had ceased. Upon yoke release a stop watch was started. Altitude, airspeed and time were recorded at
the highest and lowest altitude of each cycle.
This process is identical for the stick fixed case except that the yoke
was held in place by the pilot throughout the maneuver. The entire
procedure was repeated at an airspeed of 140 mph. An extra run was conducted for each airspeed
where the initial input was an acceleration vice a deceleration. Additionally, during the 100 mph stick free
(decel) run the GAIMS unit was started at exactly the moment the yoke was
released and data recorded automatically throughout the maneuver. This data was serially transmitted to a host
laptop computer connected to the unit and stored in a file for future analysis.
Part II –
Data Reduction
All recorded data was
entered into an excel spreadsheet for data analysis. As was done in previous flight test all airspeeds and altitude
measurements are corrected for static position errors according to the
following relationships.
![]()
Data for the first 100 mph stick free run was
collected and reduced in the excel spreadsheet table shown below.
Table 3 100 mph Stick Free (initial decel)
|
100 mph Stick Free with initial decel of 20 mph |
|
Oat |
63 F |
|
|
|
|||||
|
Trim Conditions |
Vcas |
Vcas |
|
|
|
|
|
|
|
|
|
|
Hi |
Hc |
mph |
mph |
|
|
sigma |
|
|
Alt |
A/S |
|
|
5500 |
5507 |
100 |
102.03 |
Cas |
Hi |
std |
Hpc |
Hc |
Amp |
Amp |
|
|
|
Time |
A/S |
delt Vpc |
mph |
ft |
|
ft |
ft |
ft |
mph |
e time |
|
|
0 |
80 |
6.36 |
86.36 |
5600 |
0.8528 |
27.35 |
5627 |
120 |
-16 |
0 |
|
|
12.18 |
110 |
0.58 |
110.58 |
5450 |
0.8481 |
3.49 |
5453 |
-54 |
9 |
12.18 |
|
|
28.42 |
85 |
4.99 |
89.99 |
5560 |
0.8523 |
22.85 |
5583 |
76 |
-12 |
16.24 |
|
|
45.85 |
105 |
1.27 |
106.27 |
5480 |
0.8492 |
7.21 |
5487 |
-20 |
4 |
17.43 |
|
|
54.68 |
90 |
3.85 |
93.85 |
5500 |
0.8517 |
18.69 |
5519 |
12 |
-8 |
8.83 |
|
|
64 |
103 |
1.56 |
104.56 |
5500 |
0.8502 |
8.70 |
5509 |
2 |
3 |
9.32 |
|
|
84.8 |
98 |
2.35 |
100.35 |
5520 |
0.8512 |
12.46 |
5532 |
25 |
-2 |
20.8 |
The amplitude of both airspeed and altitude response
was determined by subtracting the trim condition from the raw data. This procedure is more valid for
airspeed as it tended to oscillate
consistently about the trim airspeed of 100 mph, whereas altitude tended to
oscillate about an slightly increasing value as the maneuver progressed. A plot of the phugoid response is shown in
the figure below.
Figure 1
100 mph Stick free phugoid
PERIOD![]()
![]()
![]()
![]()
The GAIMS data was extracted and plotted in MATLAB and is shown in the figure below.
The period of oscillation is determined by subtracting the times of two successive peaks (or valleys). Because the data gathered by hand is based on pilot judgment as to when the aircraft reached a peak (or valley) the hand calculated period was determined by averaging the periods of successive peaks. GAIMS data is collected automatically and therefore the period was determined from the first two peaks directly. These results are shown in the table below.
|
100
mph Stick Free Phugoid Period |
||
|
|
Hand
collected Data |
GAIMS
Data |
|
Period (sec) |
28.27 sec |
28.29 sec |
The damping ratio ζ is determined using the log decrement procedure according to the following relationship:
 , where YA
and YB are the amplitudes of successive peaks. Solving algebraically for ζ results in:
, where YA
and YB are the amplitudes of successive peaks. Solving algebraically for ζ results in:
The result of this calculation for both the hand and GAIMS collected data is shown in the table below.
Table 5 Phugoid Damping Ratio ζ
|
100
mph Stick Free Phugoid Damping Ratio ζ |
||
|
|
Hand
collected Data |
GAIMS
Data |
|
ζ
damping ratio |
.1148 |
.0986 |
Using both values of ζ and T (period) calculated above, the damped and undamped natural frequencies are determined by:
![]() where ωd
is the damped natural frequency and
where ωd
is the damped natural frequency and
 , where ωn
is the undamped natural frequency and is given in the table below along with
ωd.
, where ωn
is the undamped natural frequency and is given in the table below along with
ωd.
|
100
mph Stick Free Phugoid Natural Frequencies |
||
|
|
Manual |
GAIMS
|
|
Damped |
.2217 |
.2219 |
|
Undamped |
.2236 |
.22307 |
These values can be used to model the phugoid response as a second order system with a transfer function of the following form:
![]() , substituting the
calculated values of ωn and ζ for both the manually
collected and GAIMS collected data results in the following transfer functions.
, substituting the
calculated values of ωn and ζ for both the manually
collected and GAIMS collected data results in the following transfer functions.
Table 7 100 mph Phugoid Transfer Function
|
100
mph Stick Free Phugoid Transfer Functions |
|
|
Manual |
GAIMS |
|
|
|
Using MATLAB to apply a step input to both transfer functions and plotting the result along with a plot of raw airspeed data shows good correspondence between the model and reality as shown in the figure below.
Identical procedures were carried out for the remaining runs. Plots of amplitude vs. time for each are shown in the figures below. Data for each run is included in the appendix.
Figure 5 140 mph Stick Free (accel)
Part III
- Conclusions
Using the same methods of data reduction as the 100 mph stick free run results in values of T (period), ζ , ωd and ωn for each case as shown in the table below.
Table 8 Phugoid Response Table
|
Phugoid
Response Summary Table |
||||||||
|
|
|
|
Wd |
|
Wn |
Initial Alt |
Final
Alt |
Vias
final |
|
Vias |
Mode |
T |
(r/sec) |
Zeta |
(r/sec) |
ft |
ft |
mph |
|
100 |
Free |
28.27 |
0.2222 |
0.1148 |
0.2236 |
5500 |
5532 |
98 |
|
100 |
Fixed |
28.19 |
0.2228 |
0.0723 |
0.2234 |
5550 |
5562 |
99 |
|
100 |
Free
(accel) |
27.68 |
0.2269 |
0.1320 |
0.2289 |
5550 |
5509 |
102 |
|
140 |
Free |
33.13 |
0.1896 |
0.0979 |
0.1905 |
5500 |
5544 |
140 |
|
140 |
Fixed |
33.59 |
0.1870 |
0.1169 |
0.1883 |
5500 |
5734 |
140 |
|
140 |
Free
(accel) |
32.82 |
0.1913 |
0.1160 |
0.1926 |
5500 |
5484 |
140 |
|
|
|
|
|
|
|
|
|
|
|
GAIMS Data |
T |
Wd |
Zeta |
Wn |
|
|
|
|
|
100 |
Free |
28.29 |
0.22199 |
0.0986 |
0.2231 |
|
|
|
The results are very consistent between similar runs. The correlation between the period calculated by GAIMS and the manual data run are excellent with only a .02 second difference. The period obviously grew longer with an increase in airspeed with the initial acceleration runs showing slightly reduced periods than the deceleration runs of similar trim airspeed. Differences between stick free and fixed are negligible. Values of ζ show slight variation between runs, which is attributed to the sensitivity of the natural log and square terms in the equation used to solve for ζ. Stick fixed runs have a tendency to result in final altitudes slightly higher than the stick free case, although trim airspeed was attained in all cases within 2 mph cas. Although the flight control system is not frictionless the relatively large trim tab area generates a significant restoring moment anytime the stab is displaced from its trim position. This is a noteworthy feature as it allows for trimming the airplane to a constant speed and altitude an easy task. The airplane exhibits stable phugoid response and returns to its trim state in under two minutes with little deviation in altitude and almost no deviation in airspeed a good quality for IMC flight.
The comparison of manually collected data to the electronically collected data from the G.A.I.M.S. unit shows good correlation, however; results from this test cannot be used to conclusively validate either method. Particularly because the only sensor collecting data was the vertical accelerometer which is also sensitive to roll angles thus corrupting the phugoid data anytime a slight roll was initiated. To accurately depict the true phugoid response using the GAIMS unit requires correlation of accelerations in all three axis to offset the effect of lateral directional motion during the maneuver. This will be the subject of future flight test and GAIMS validation.
Further phugoid testing should be done at various c.g. locations to investigate the longitudinal stability with both extreme forward and aft c.g. configurations. The Kopp BD-4 Performance Summary table is included below.
Table 9 Kopp BD-4 Performance Summary Table
Altitude / Weight
|
Max Cl/Cd |
Min Thrust Required |
|
3000 ft / 1950 lbs |
8.8235 |
217.87 lbs |
|
7500 ft / 2130 lbs |
9.0329 |
229.63 lbs |
Parameters
|
Drag Polar
|
Power Curve
|
Cdo
|
0.0440
|
0.0425
|
e
|
0.7031
|
0.6507
|
|
Altitude |
Minimum Thrust Horsepower Required |
|
|
3500
ft 1950 lbs |
52.33
HP |
|
|
7500
ft 2130 lbs |
60.59
HP |
|
|
Standardized
|
59.16
HP |
|
|
Vx
(ias) |
75
mph |
|
|
Vy
(ias) |
90
mph |
|
|
R/Cmax
S.L max GW |
799
fpm |
|
|
AOCmax
S.L. max GW |
5.71° |
|
|
Service
Ceiling @ max GW |
10,600
ft |
|
|
Absolute
Ceiling @ max GW |
11,400
ft |
|
|
Longitudinal Stability |
||
|
Stick
Free / Fixed Neutral Point |
36.5%
(mac) |
|
|
Forward
cg static margin |
16.5%
(mac) |
|
|
Aft
cg static margin |
5.25%
(mac) |
|
|
Phugoid
Period (100 mph) |
28.29
seconds |
|
|
Phugoid
Period (140 mph) |
33.2
seconds |
|
|
ζ
damping ratio |
.11 |
|
Appendix
|
Stick Free with initial accel of 20 mph |
100 mph |
Free |
|
|
|
|
|
||||
|
Trim
Conditions |
|
|
|
|
|
|
|
|
|
|
|
|
Hi |
Hc |
Vias mph |
Vcas mph |
|
|
|
|
|
Altitude |
A/S |
|
|
5500 |
5507 |
100 |
102.03 |
Cas |
Hi |
sigma std |
delt Hpc |
Hc |
Amplitude |
Amplitude |
|
|
OAT |
Time |
A/S (mph) |
delt Vpc |
mph |
ft |
|
ft |
ft |
ft |
mph |
e time |
|
63 |
0 |
120 |
-0.59 |
119.41 |
5440 |
0.8528 |
-3.8246 |
5436 |
-72.04 |
17.38 |
0 |
|
|
13.75 |
85 |
4.99 |
89.99 |
5620 |
0.8481 |
22.958 |
5643 |
134.74 |
-12.04 |
13.75 |
|
|
25.83 |
112 |
0.33 |
112.33 |
5460 |
0.8523 |
1.9916 |
5462 |
-46.23 |
10.30 |
12.08 |
|
|
40.83 |
93 |
3.25 |
96.25 |
5580 |
0.8492 |
16.351 |
5596 |
88.13 |
-5.78 |
15 |
|
|
52.82 |
107 |
0.99 |
107.99 |
5480 |
0.8517 |
5.699 |
5486 |
-22.52 |
5.96 |
11.99 |
|
|
68.58 |
98 |
2.35 |
100.35 |
5540 |
0.8502 |
12.471 |
5552 |
44.25 |
-1.68 |
15.76 |
|
|
79.45 |
105 |
1.27 |
106.27 |
5500 |
0.8512 |
7.1929 |
5507 |
-1.03 |
4.24 |
10.87 |
|
|
96.6 |
100 |
2.03 |
102.03 |
5505 |
0.8511 |
10.943 |
5516 |
7.72 |
0.00 |
17.15 |
|
|
110.7 |
102 |
1.71 |
103.71 |
5500 |
0.8512 |
9.437 |
5509 |
1.22 |
1.68 |
14.1 |
|
|
|
|
|
|
|
|
|
|
|
|
|
|
Stick Fixed with initial decel of 20 mph |
100 mph |
Fixed |
|
|
|
|
|
||||
|
Trim
Conditions |
|
|
|
|
|
|
|
|
|
|
|
|
Hi |
Hc |
Vias mph |
Vcas mph |
|
|
|
|
|
Altituded |
A/S |
|
|
5500 |
5507 |
100 |
102.03 |
Cas |
Hi |
sigma std |
delt Hpc |
Hc |
Amplitude |
Amplitude |
|
|
OAT |
Time |
A/S (mph) |
delt Vpc |
mph |
ft |
|
ft |
ft |
ft |
mph |
e time |
|
63 |
0 |
80 |
6.36 |
86.36 |
5660 |
0.8471 |
27.534 |
5688 |
181 |
-16 |
0 |
|
|
12.8 |
115 |
-0.03 |
114.97 |
5530 |
0.8505 |
-0.2133 |
5530 |
23 |
13 |
12.8 |
|
|
30.19 |
90 |
3.85 |
93.85 |
5650 |
0.8474 |
18.784 |
5669 |
162 |
-8 |
17.39 |
|
|
43.34 |
108 |
0.85 |
108.85 |
5550 |
0.8499 |
4.9662 |
5555 |
48 |
7 |
13.15 |
|
|
56.42 |
92 |
3.45 |
95.45 |
5600 |
0.8487 |
17.151 |
5617 |
110 |
-7 |
13.08 |
|
|
67.3 |
104 |
1.41 |
105.41 |
5560 |
0.8497 |
7.954 |
5568 |
61 |
3 |
10.88 |
|
|
84.37 |
97 |
2.52 |
99.52 |
5580 |
0.8492 |
13.249 |
5593 |
86 |
-3 |
17.07 |
|
|
98.65 |
99 |
2.19 |
101.19 |
5550 |
0.8499 |
11.715 |
5562 |
55 |
-1 |
14.28 |
|
Stick Free with initial accel of 20 mph |
140 mph |
Free |
Accel |
|
|
|
|
||||
|
Trim
Conditions |
|
|
|
|
|
|
|
|
|
|
|
|
Hi |
Hc |
Vias mph |
Vcas mph |
|
|
|
|
|
Altitude |
A/S |
|
|
5500 |
5484 |
140 |
137.9 |
Cas |
Hi |
sigma std |
delt Hpc |
Hc |
Amplitude |
Amplitude |
|
|
OAT |
Time |
A/S (mph) |
delt Vpc |
mph |
ft |
|
ft |
ft |
ft |
mph |
e time |
|
65 |
0 |
160 |
-2.46 |
157.54 |
5400 |
0.8538 |
-21.509 |
5378 |
-106 |
20 |
0 |
|
|
16.91 |
129 |
-1.42 |
127.58 |
5600 |
0.8487 |
-9.9743 |
5590 |
106 |
-10 |
16.91 |
|
|
34.87 |
150 |
-2.40 |
147.60 |
5420 |
0.8533 |
-19.58 |
5400 |
-84 |
10 |
17.96 |
|
|
51.25 |
136 |
-1.90 |
134.10 |
5540 |
0.8502 |
-14.068 |
5526 |
42 |
-4 |
16.38 |
|
|
67.56 |
146 |
-2.31 |
143.69 |
5460 |
0.8523 |
-18.406 |
5442 |
-42 |
6 |
16.31 |
|
|
82.94 |
138 |
-2.01 |
135.99 |
5500 |
0.8512 |
-15.08 |
5485 |
1 |
-2 |
15.38 |
|
|
100.22 |
143 |
-2.22 |
140.78 |
5460 |
0.8523 |
-17.3 |
5443 |
-41 |
3 |
17.28 |
|
|
114.88 |
140 |
-2.10 |
137.90 |
5500 |
0.8512 |
-16.034 |
5484 |
0 |
0 |
14.66 |
|
Stick Fixed with initial decel of 20 mph |
140 mph |
Fixed |
Decel |
|
|
|
|
||||
|
Trim
Conditions |
|
|
|
|
|
|
|
|
|
|
|
|
Hi |
Hc |
Vias mph |
Vcas mph |
|
|
|
|
|
Altitude |
A/S |
|
|
5500 |
5484 |
140 |
137.9 |
Cas |
Hi |
Sigma Std |
Delt Hpc |
Hc |
Amplitude |
Amplitude |
|
|
OAT |
Time |
A/S (mph) |
delt Vpc |
mph |
ft |
|
ft |
ft |
ft |
mph |
e time |
|
65 |
0 |
120 |
-0.59 |
119.41 |
5800 |
0.8435 |
-3.8667 |
5796 |
312 |
-18 |
0 |
|
|
17.91 |
155 |
-2.45 |
152.55 |
5500 |
0.8512 |
-20.739 |
5479 |
-5 |
15 |
17.91 |
|
|
33.76 |
128 |
-1.34 |
126.66 |
5780 |
0.844 |
-9.3823 |
5771 |
287 |
-11 |
15.85 |
|
|
51 |
144 |
-2.26 |
141.74 |
5650 |
0.8474 |
-17.791 |
5632 |
148 |
4 |
17.24 |
|
|
64.59 |
132 |
-1.64 |
130.36 |
5750 |
0.8448 |
-11.882 |
5738 |
254 |
-8 |
13.59 |
|
|
83.66 |
140 |
-2.10 |
137.90 |
5720 |
0.8456 |
-16.142 |
5704 |
220 |
0 |
19.07 |
|
|
100.34 |
138 |
-2.01 |
135.99 |
5780 |
0.844 |
-15.208 |
5765 |
281 |
-2 |
16.68 |
|
|
117.56 |
140 |
-2.10 |
137.90 |
5750 |
0.8448 |
-16.157 |
5734 |
250 |
0 |
17.22 |
|
|
|
|
|
|
|
|
|
|
|
|
|
|
|
|
|
140 mph |
Free |
Decel |
|
Stick Free with initial decel of 20 mph |
||||
|
Trim Conditions |
|
|
|
|
|
|
|
|
|
|
|
|
Hi |
Hc |
Vias mph |
Vcas mph |
|
|
|
|
|
Altitude |
A/S |
|
|
5500 |
5484 |
140 |
137.9 |
Cas |
Hi |
Sigma Std |
Delt Hpc |
Hc |
Amplitude |
Amplitude |
|
|
OAT |
Time |
A/S (mph) |
delt Vpc |
mph |
ft |
|
ft |
ft |
ft |
mph |
e time |
|
65 |
0 |
120 |
-0.59 |
119.41 |
5700 |
0.8461 |
-3.8549 |
5696 |
212 |
-18 |
0 |
|
|
17.66 |
155 |
-2.45 |
152.55 |
5450 |
0.8525 |
-20.707 |
5429 |
-55 |
15 |
17.66 |
|
|
32.55 |
130 |
-1.50 |
128.50 |
5650 |
0.8474 |
-10.622 |
5639 |
155 |
-9 |
14.89 |
|
|
50.45 |
150 |
-2.40 |
147.60 |
5480 |
0.8517 |
-19.616 |
5460 |
-24 |
10 |
17.9 |
|
|
64.95 |
135 |
-1.84 |
133.16 |
5580 |
0.8492 |
-13.543 |
5566 |
82 |
-5 |
14.5 |
|
|
84.01 |
145 |
-2.29 |
142.71 |
5500 |
0.8512 |
-18.079 |
5482 |
-2 |
5 |
19.06 |
|
|
100.1 |
138 |
-2.01 |
135.99 |
5550 |
0.8499 |
-15.102 |
5535 |
51 |
-2 |
16.09 |
|
|
115.95 |
142 |
-2.19 |
139.81 |
5520 |
0.8507 |
-16.922 |
5503 |
19 |
2 |
15.85 |
|
|
135.59 |
140 |
-2.10 |
137.90 |
5560 |
0.8497 |
-16.064 |
5544 |
60 |
0 |
|
About the author:
LT
Kenneth G. Kopp is an active duty Naval Aviator flying SH-60B “Seahawk”
helicopters. He has been selected to attend the Naval Test Pilot School in
Patuxent River, MD and recently completed all academic requirements for a
Masters of Science in Aeronautical Engineering from the Naval Post Graduate
School in Monterey, California, which will be awarded upon successful
completion of the Test Pilot curriculum. He is co-builder and owner of the Kopp
BD-4. His FAA ratings included: Fixed/Rotary commercial, instrument and CFI. He
is current in the following aircraft models: SH-60B, TC-12B, T-34, BD-4, C-172,
C-152.